Building the Knowledge Graph for Project Culper
One of the big ideas behind Project Culper is that intelligence entries shouldn’t just sit in a list. Real field work is relational: a name shows up in one report, comes back in another, and over time starts painting a picture. The knowledge graph is how we actually show that picture.
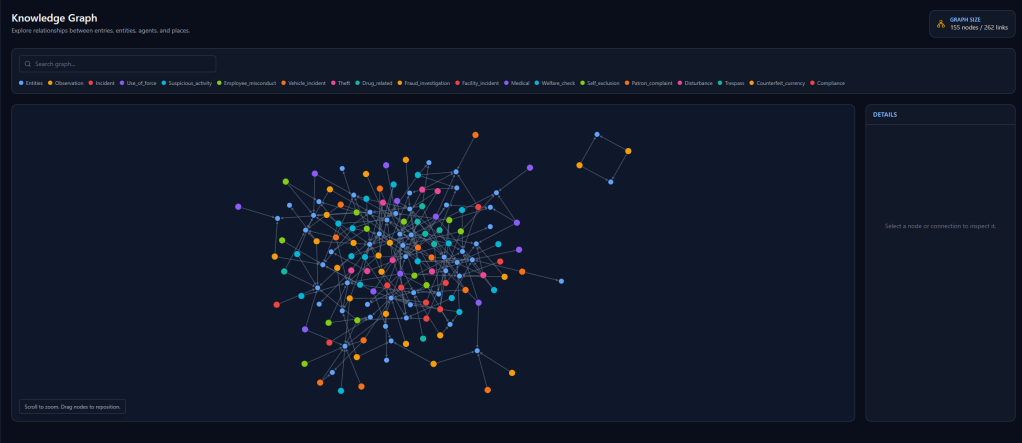
The work happened in three stages. Zac got the graph up and running on the frontend first: an interactive Cytoscape.js visualization with a details panel that pops up when you click a node and a custom useGraph hook to manage state. Pan, zoom, click around. It worked, and it looked good.
Then I came in on the backend side. I built a linking agent that runs our spaCy NER microservice over intelligence entries, pulls out named entity spans, and proposes connections between entries that reference the same people, places, or organizations. Under the hood that meant two new database tables, an async Celery pipeline so the processing doesn’t block the API, and a dashboard interface for triggering and monitoring jobs.
The last piece was wiring it all together. I added a /api/graph route that runs Cypher queries against Apache AGE (our graph layer inside PostgreSQL), grabs the real entity-relationship data, and hands it to the frontend. Zac’s useGraph hook got refactored to pull from that live endpoint instead of mock data, and the graph component now renders actual nodes and edges from the database.
The graph is live on real data now. Color coding is already in and dynamic, pulling from whatever entity types are actually present in the dataset. Next up: filtering so you can isolate specific types and keep things readable as the data grows.
